
For Influencers: How to Report Your Campaign Results
By Dalene Heck and Catherine Reed
I’ve spoken in front of many travel industry audiences in the last couple of years, sat across the desk from many travel brands, and sent out surveys. And each time I ask how we – and influencers – can serve our clients better. I have consistently received one singular response that stands out:
We want more [or better] reporting.
And it always astounds me that this is the response I receive. For here we are, many years into this prosperous wave of influencer marketing, and there is still such an obvious gap in the relationship. And it’s such an easy one to fill!
As an influencer, sharing the results of your campaign is essential. It allows you to showcase the success of a collaboration, demonstrates your true influence, and could lead to more work. And, just as importantly, it allows your partner to use that triumph to advocate for further influencer marketing campaigns that could benefit you and your colleagues.
We ALL win when successes are shared.
It astounds me when travel brands report that some influencers just refuse to share details, or else demand payment to do so. If you are one of those influencers holding out on providing proper reports – for whatever reason – we urge you to rethink your position and consider the bigger picture. But if you are new to industry partnerships and simply lacking the know-how to put a solid report together, then we’re here to show you how.
Finding Your Campaign and Account Stats
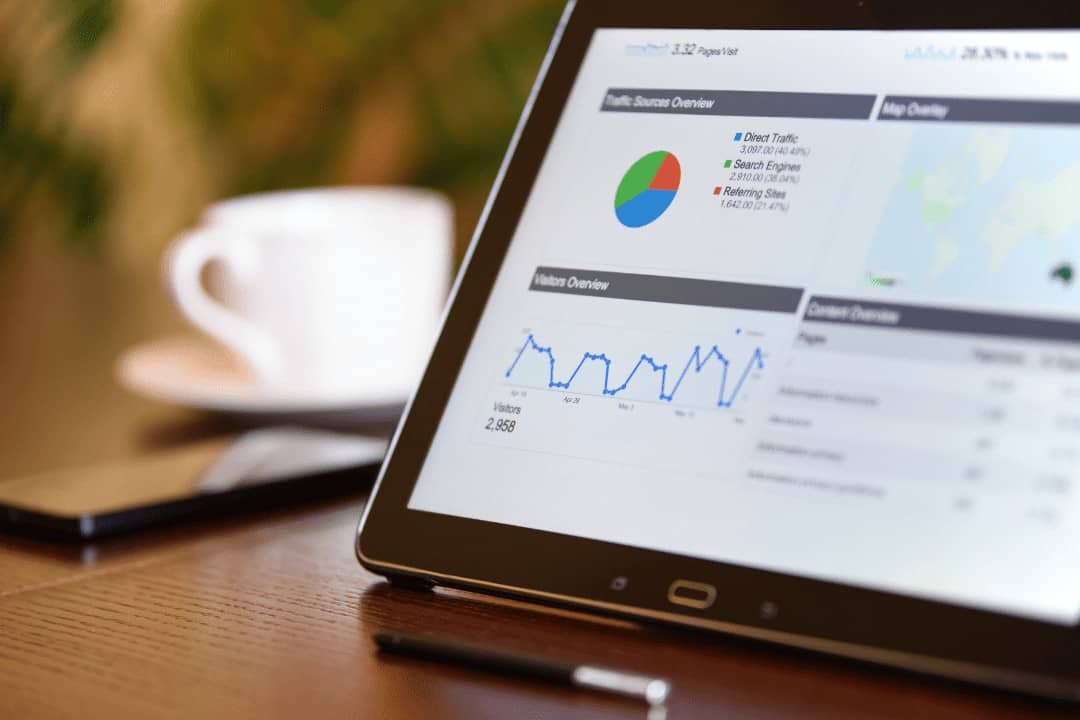
In order to properly report campaign results, you’ll need to gather some data. Most social media platforms give accounts access to a range of insights and analytics tools to provide you exactly what you need.
With a business account on Instagram, you have the ability to view a variety of insights about your audience, engagement, and campaign results. Getting to the information is simple. After going to your profile, tap the menu button. Then, tap Insights.
When you first open the Insights section, you’ll end up on the Activity tab. Here, you can get details about your account overall, such as weekly Impressions, Reach, and Interactions. When you explore the Interactions information, you can see whether the person headed to your profile, clicked over to the website, and more.
On the Audience tab, you can learn more about those who follow you as well as who engages with your content. Along with demographics, you can also see your follower growth rate, which can be important information to share.
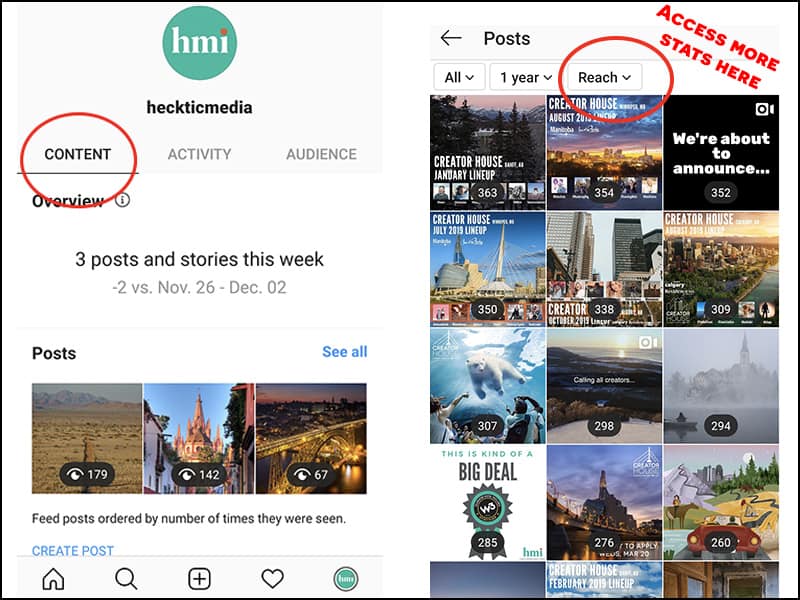
However, when it comes to campaign results, there is one tab you want to use above all: the Content section. Here, you can select specific stories, posts, or promotions, allowing you to focus on posts that align with the campaign.
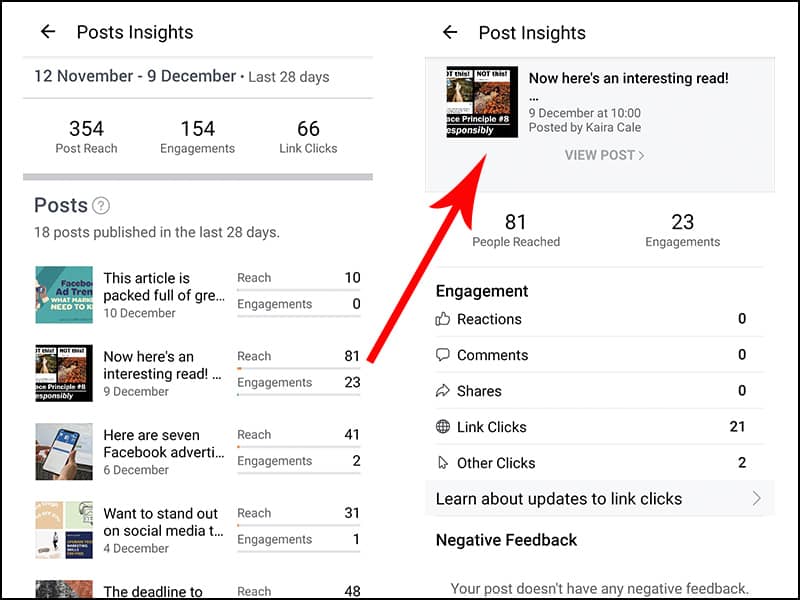
After you find the right post or story, you’ll be greeted with valuable data. Since you are focused on showcasing your campaign results, you’ll likely be most interested in the Impressions, Engagement, Sticker Taps, and Website Clicks details.
These metrics are all worthy of sharing, especially those that measure action. With Sticker Taps especially, you can see how many times a person clicked through to the brand you mentioned.
Facebook also makes it fairly simple to collect data about your posts and account. At the top of the page, click the Insights button (if you don’t see Insights, tap More first and then tap Insights). There, you’ll gain access to a ton of information, including visitor demographics, engagement, and page performance.
You also have the ability to drill down, capturing data segments that you want to share. And clicking on Posts will allow you to hone in on those exact Facebook posts that pertain to the client you want to report to.
You’ll see all the data you need at one glance including different engagement metrics and click data. Alternatively, this data is also available for download into a spreadsheet so that you can calculate whatever you like (ideal for bigger campaigns with lots of posts). Go to the Overview page and click Export Data in the top right corner. Set your parameters (applicable date, and that you want post level data), download, and get to analyzing!
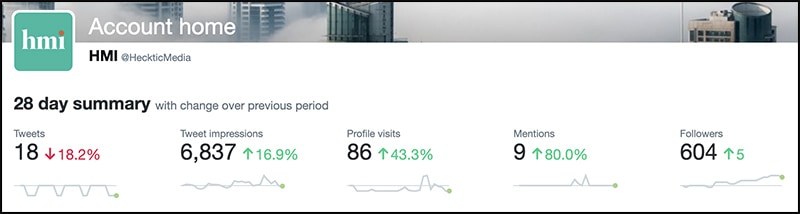
For details about your Twitter statistics, you’ll need to head to your Analytics Dashboards. There, you can find out about your campaign success, followers, and more.
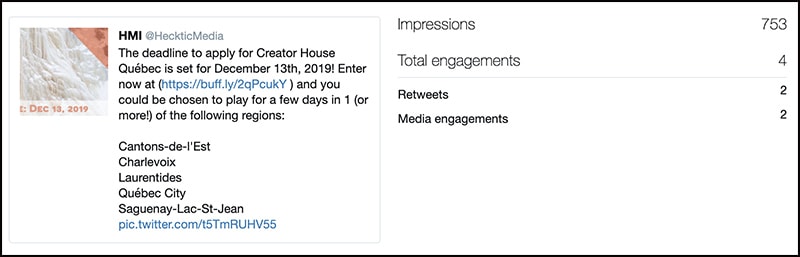
In the Tweet Activity dashboard, you’ll be able to gather data about your engagement rates. Not only are their overview statistics for your account, but you can also click on individual tweets to get a close look at that post’s performance. Along with retweet, reply, like, and follow information, you can also see how many clicks the post received. There’s impression data as well, giving you a look at how many times a tweet was potentially viewed. Similar to Facebook, this is also downloadable, so all of the information is easily sortable and comparable, enabling quick reporting on bigger campaigns.
If you use video content on Twitter, you’ll be able to review additional data. You can find out how people are reacting to your video, including whether people are watching the whole thing or leaving before it’s done. If a video was part of the campaign, this is excellent information to share.
Blog or Website
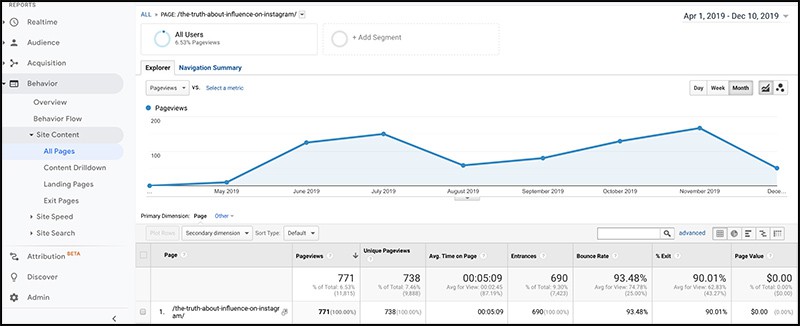
Gathering information about your blog or website isn’t a challenge. Google Analytics can tell you almost anything you’d want to know, including details about your audience, view numbers, bounce rates, traffic sources, and more.
If you want campaign-specific data, you can drill down, focusing solely on the article in question. That way, you can determine traffic sources, length of time on page, engagement rates, and anything else you’d want to know about that post’s performance. You’ll also be able to view if a person followed your call-to-action, such as by clicking a particular link. Since most campaigns that involve blog posts are all about driving traffic or sales elsewhere, those are details you’ll want to share.
For basic pageviews, go to Behaviour -> Site Content -> All Pages and then search by the URL you wish to find information for.
Beyond the numbers
Going beyond basic numbers is key to reporting a more holistic review of a campaign. How did readers or followers interact with your posts? Did you receive any comments like: “I just bought this because of your post,” or “Wow, Nova Scotia just moved up on my bucket list!”?
This sort of positive association between reader and brand is valuable and very worth reporting. Keep track of these comments (take screenshots, even) during the campaign and file them away. Include them in your final report so that the brand can see all the positive interactions that came out of their work with you.
Reporting Your Results and Statistics
When you report on your campaign results, you want to be clear and concise. A mountain of data is overwhelming, so you need to make your report as focused as possible. And that’s where a template comes in.
With a simple template, such as the example below, you can share critical details without going overboard. If you don’t know where to start, here’s one that could work for most campaigns.
You may also want to read:
How Influencer Relations Differ from Public Relations
Keeping it Legal: Travel Influencer Disclosure Guidelines in North America
11 Creative Ways to Work with Influencers: Going Beyond the Press Trip